SCIENTIFICAMERICAN | Math
Venn Diagrams' History and Popularity Outside of Math Explained
维恩图的历史及其在数学之外的普及解释
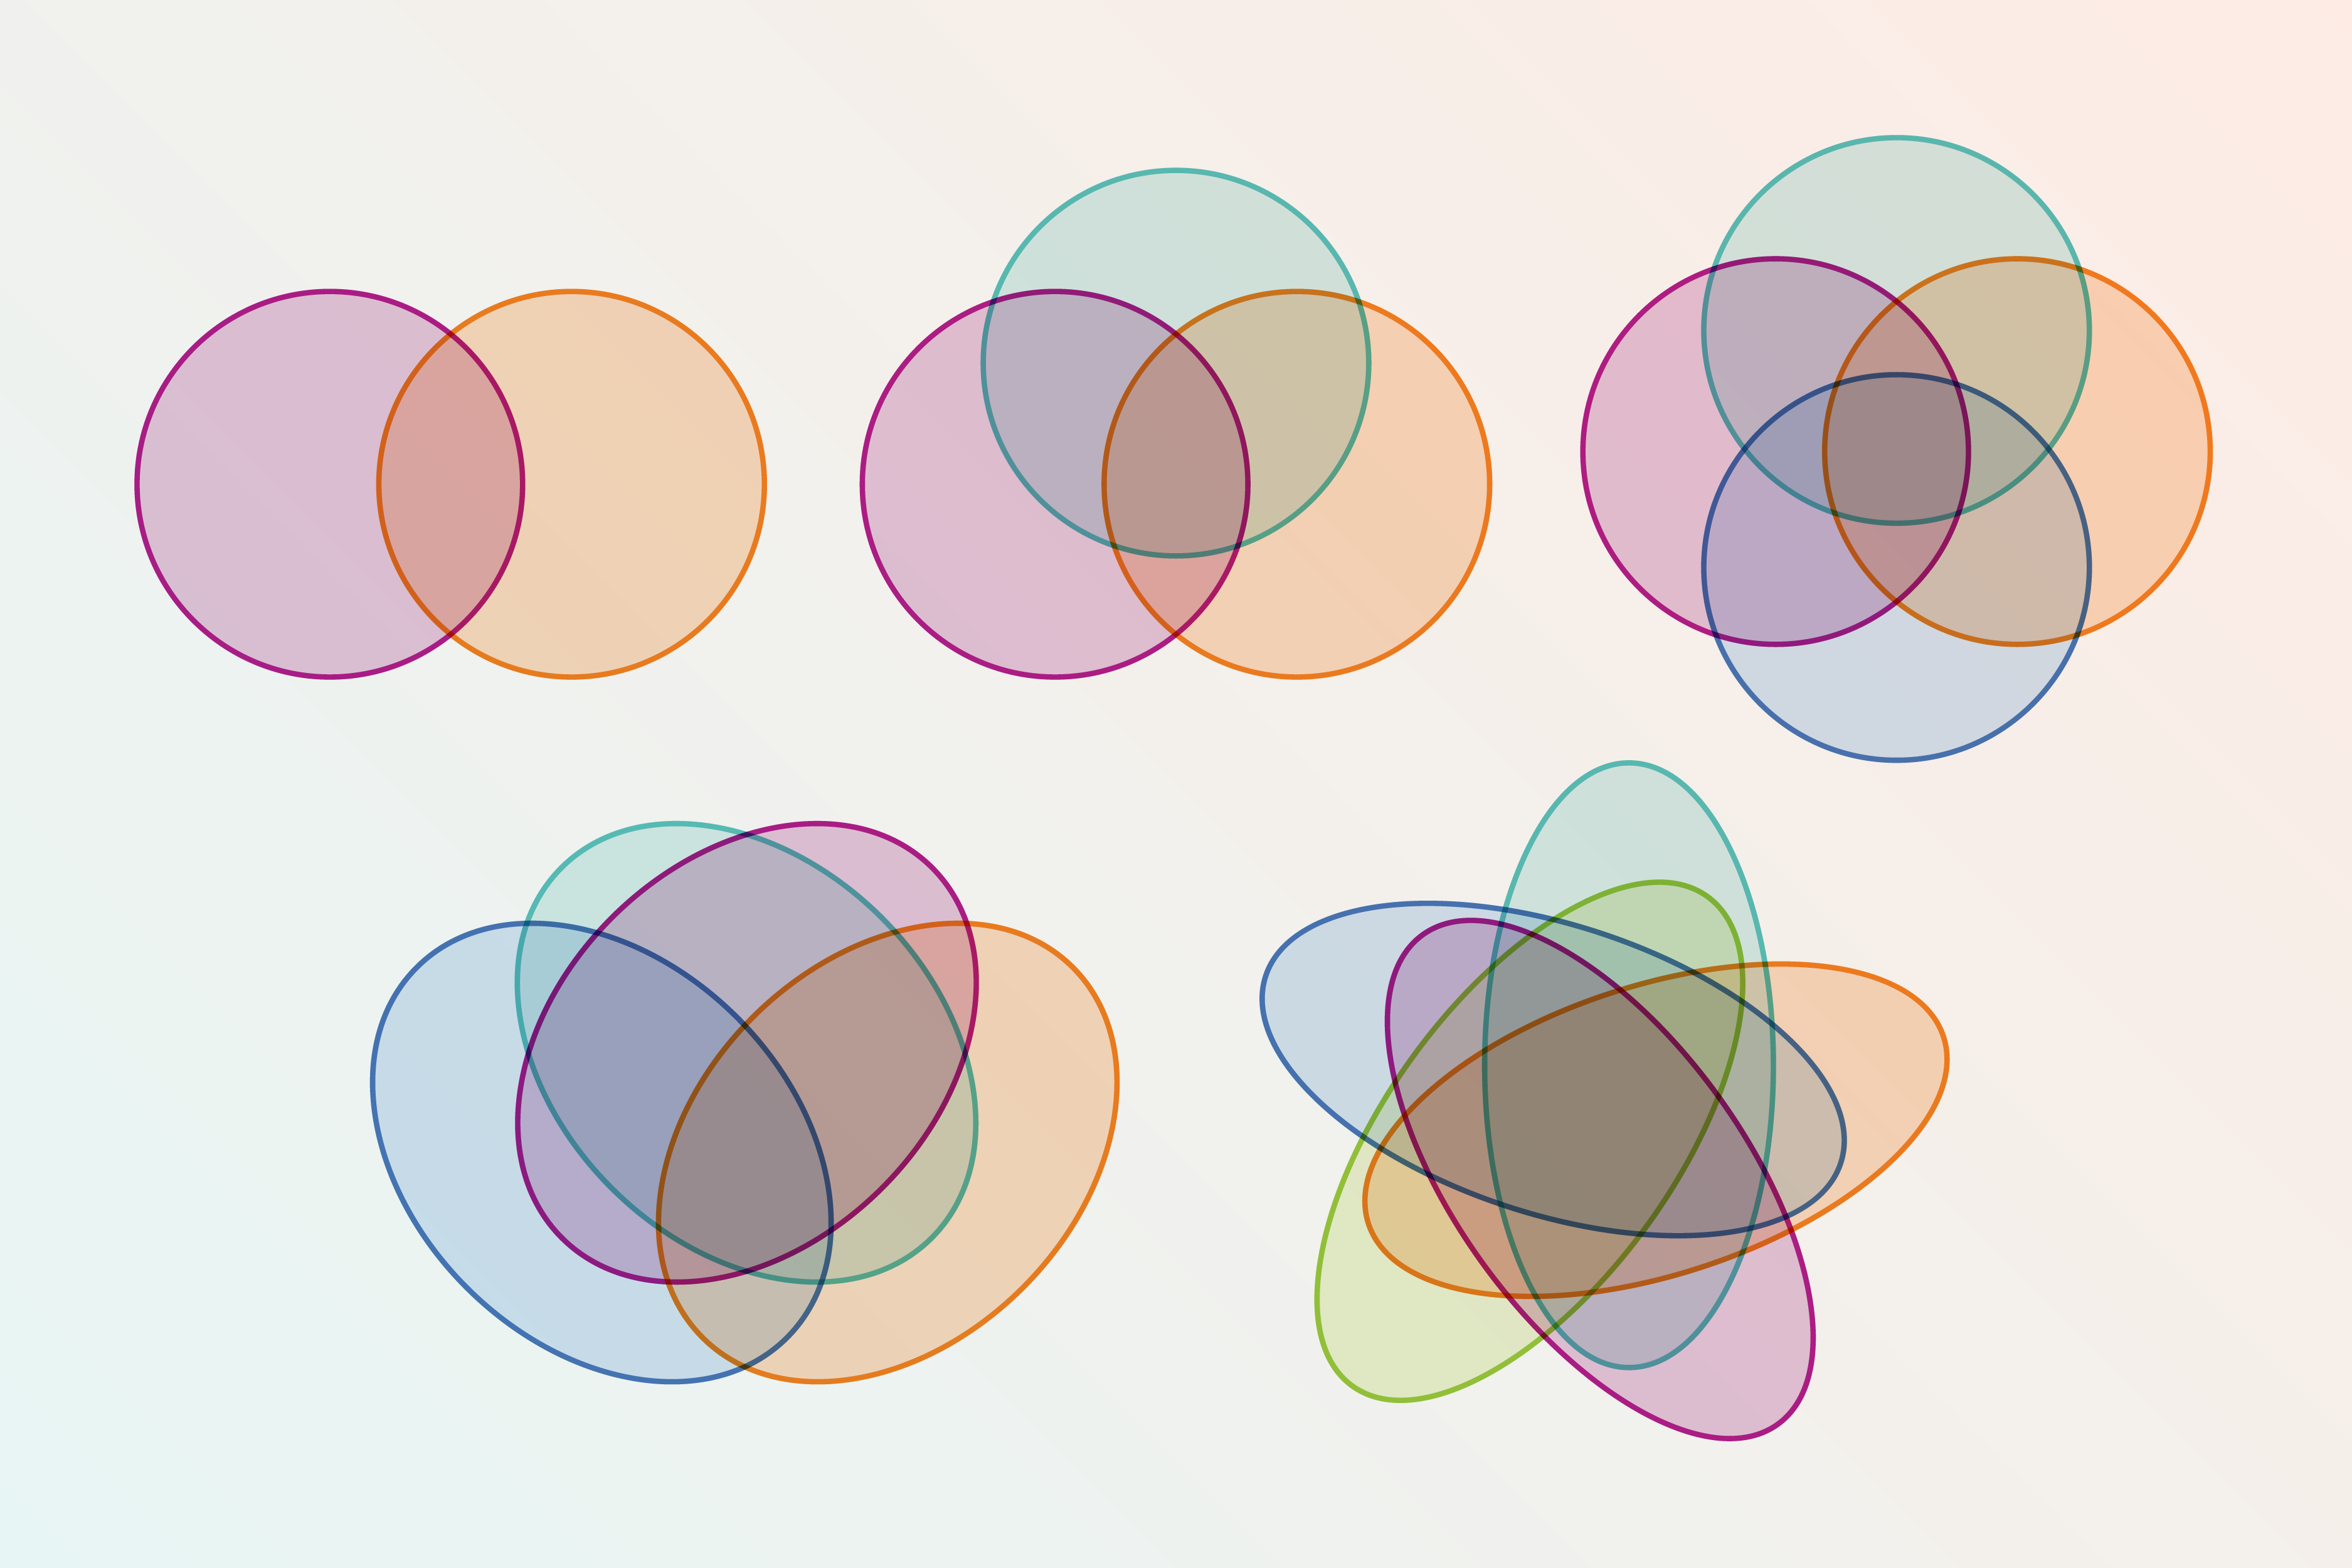
Series of colorful Venn diagrams made of various numbers of circles or ovals
2025-01-14 1140词 困难
Venn debuted his diagrams in 1880 as a method for visualizing contemporary advances in logic. They then found application in the closely related branch of math called set theory, which focuses on collections of objects. Venn diagrams typically consist of overlapping circles, with each representing some set of elements, (e.g., things that are cuddly or Broadway shows). The overlapping region between two circles contains elements that belong to both sets (e.g., “cats”). Much like in using scatter plots in statistics or drawing shapes in geometry, seeing one’s problem often clarifies it.
免责声明:本文来自网络公开资料,仅供学习交流,其观点和倾向不代表本站立场。